Finance & Bookkeeping
Every dollar in and out of the rabbitry lands in one ledger: sales and deposits written automatically by the sale flow, feed and supplies you enter yourself. Each row is income or expense with a category, and the totals are calculated across whatever you have filtered to, so "what did feed cost me last year" is a filter, not a spreadsheet. All of it exports as CSV.
Record income and expenses
- Web App
- Mobile App
Go to Dashboard → Finance and add a transaction: type, category, amount, date, and a description.
A purchase can also be linked to your inventory as you record it — a bag of feed becomes both an expense and stock on hand, rather than two separate jobs.
Open Finance and add a transaction. This works offline and queues for upload.
You can also link a purchase to a rabbit when you buy one, so the cost sits with the animal it bought. That is on the rabbit form rather than the ledger.
Categories
Every transaction is income or expense, and carries one category:
| Category | Typical use |
|---|---|
| Feed | Pellets, hay, supplements |
| Meds | Medication, vet costs |
| Supplies | Cages, equipment, bedding |
| Show fees | Entries and show costs |
| Rabbit sale | Written by the sale flow |
| Rabbit purchase | An animal you bought in |
| Deposit pending | Written when a deposit is marked received |
| Other | Everything else |
Three of those are worth knowing about because you do not type them.
Where sales come from
Rabbit sale, rabbit purchase, and deposit pending rows are created by the sale flow, not entered by hand. Recording a sale writes the sale row; marking a deposit received writes the pending row and applying it removes that row again. See Deposits & Sales.
That is deliberate: it means the ledger and the animal records can never disagree about what was sold, for how much, and to whom. Each sale row stays linked to its rabbit, its buyer, and — for a kit sold out of a litter — the litter it came from.
The practical consequence is that you should not hand-enter a sale as a plain income row. Record the sale properly and the ledger takes care of itself.
Filtering and date windows
The ledger filters by date range, type, and category, and pages through results 50 at a time with a count of how many match in total.
Nothing older has been deleted — it is a starting window, not the whole ledger. Change the from-date to reach back further. If a transaction you expected is missing, widen the dates before anything else.
The summary totals — income, expense, and net — are calculated on the server across your whole filtered set, not just the rows currently loaded on screen. Filtering to Feed for last year gives you the real annual feed total even though only the first 50 rows are displayed.
Getting the numbers out
A data export produces every table in your account as CSV, including financial transactions, deposits, contacts, and inventory movements. That is the file to hand an accountant, and it is yours to take whenever you want it.
Feed and processing costs also feed the profitability dashboard, which is where cost per rabbit and margin per litter come from — those need the underlying expenses to be categorized properly, which is the real reason to pick the right category as you go.
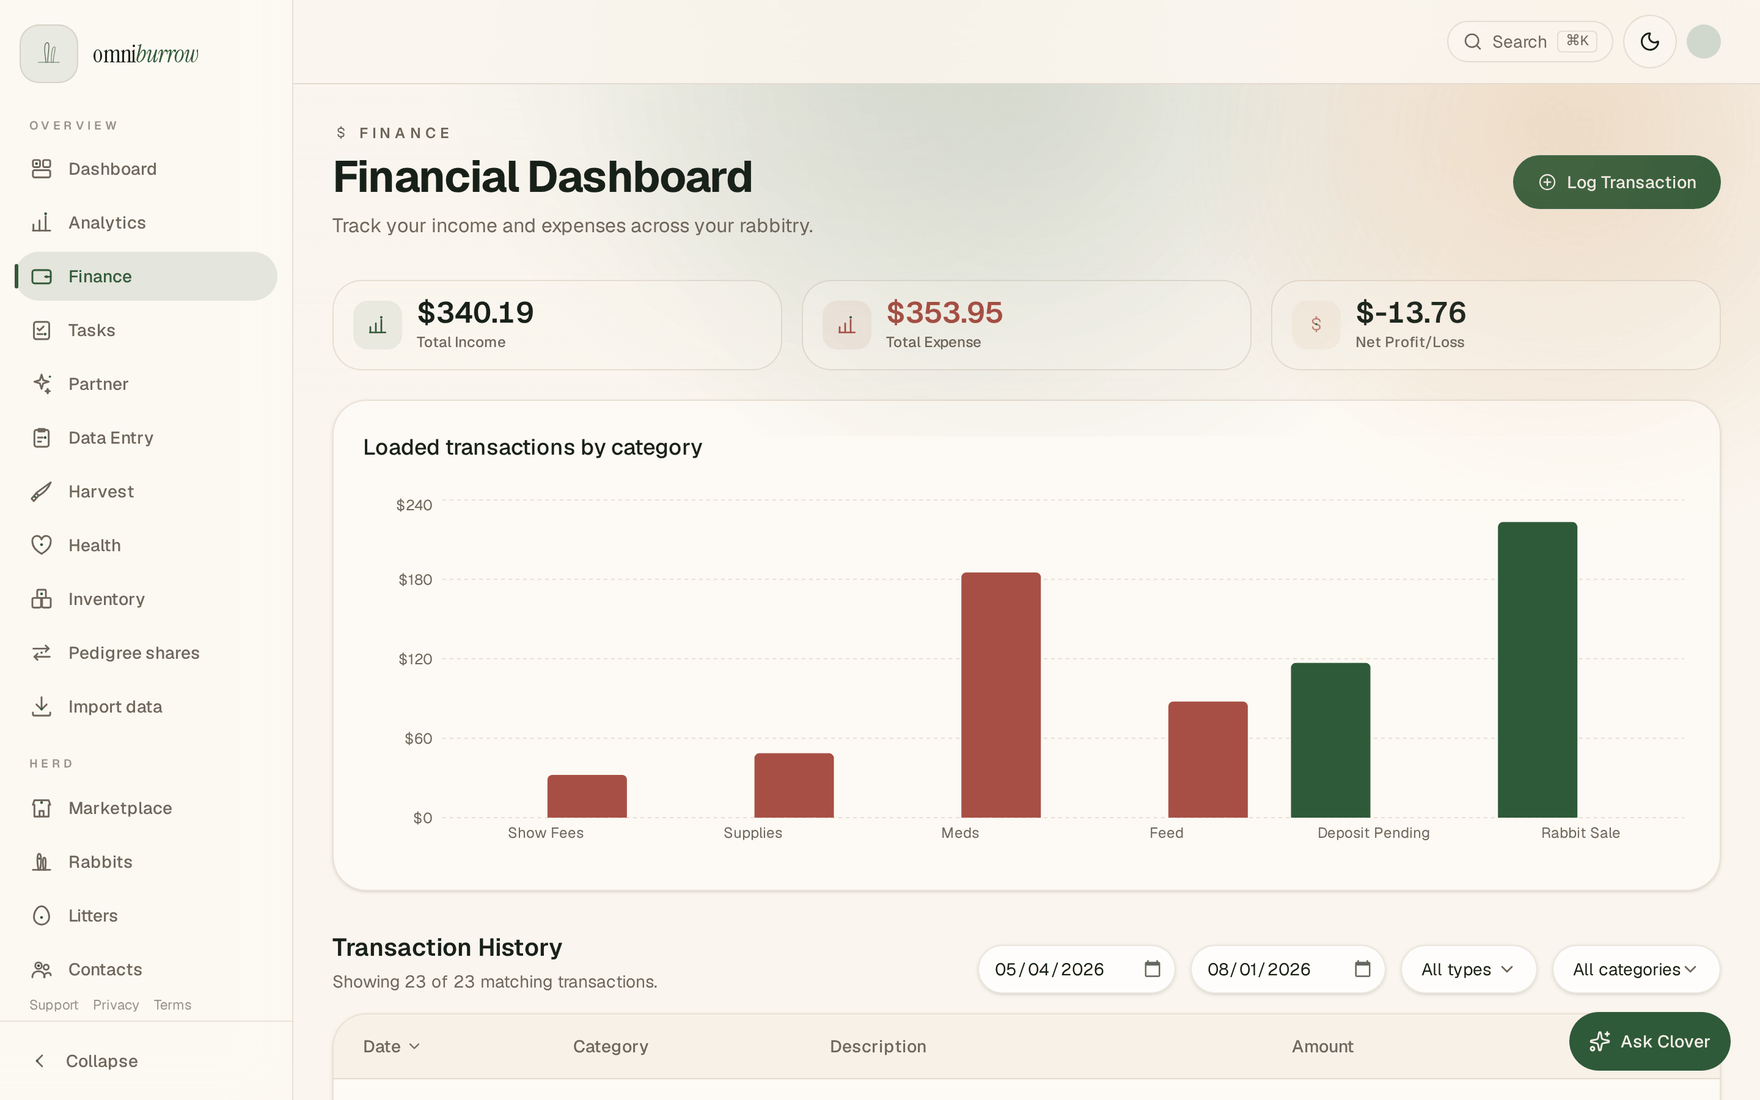
Web app: the totals reflect whatever the date range and filters are showing, not the whole book.