Production & Doe Performance
This is the dashboard for deciding who stays. It ranks every doe by how many litters she produced, how many kits, her average litter size, and her conception rate — and ranks sires the same way — against herd-wide totals for litter size, kit mortality, and growth.
What this answers
- Which does are earning their cage, and which have missed repeatedly.
- Whether the herd's litter size and kit mortality are moving in the right direction.
- Which sires are producing the growth you want.
Reading the doe table
Each doe gets a row:
| Column | What it means |
|---|---|
| Litters | How many litters in the window |
| Total kits | Kits across those litters |
| Avg litter size | Average kits per litter |
| Avg ADG | Average daily gain of her offspring, in ounces per day |
| Misses | Breedings recorded as a miss |
| False pregnancies | Breedings recorded as a false pregnancy |
| Conception rate | Litters that kindled, against everything attempted |
Conception rate only means something if you record the failures. A doe whose misses were never entered looks like a perfect producer. Recording the outcome — kindled, miss, or false pregnancy — is the one habit that makes this table honest. See Litters & Kindling.
Sires get their own ranking with the same shape, plus average dress-out percentage of their processed offspring, since that is usually what a buck is judged on.
Both tables are capped at 100 rows.
Litter and kit metrics
Across the herd, the dashboard reports:
- Total rabbits, active does, and active bucks.
- Litters this period and kits this period, with kits alive.
- Average litter size, measured in live kits.
- Kit mortality rate: total dead kits divided by total born, as a percentage.
- Average daily gain across the herd.
Each carries a comparison against the previous window of the same length, so you see direction rather than just a number.
Note what mortality here is: kit mortality inside litters, from the born and dead counts on your litter records. It is not a herd-wide death rate and it does not read health events, so an adult that died is not in this figure.
What you must record
For this dashboard to be worth looking at:
- Litters with a doe, a buck, and dates. A litter with no kindling date is not in the period.
- Accurate born and live counts, corrected after the first nest check. Dead kits is derived from those two, so getting live kits right is what makes mortality right.
- Outcomes on the breedings that failed. Without them, conception rate is meaningless.
- Weights on the kits, at least twice, if you want the ADG columns to fill in.
Confidence is marked high at five or more litters in the window, medium at two, and low below, so a quiet quarter is flagged rather than presented as fact.
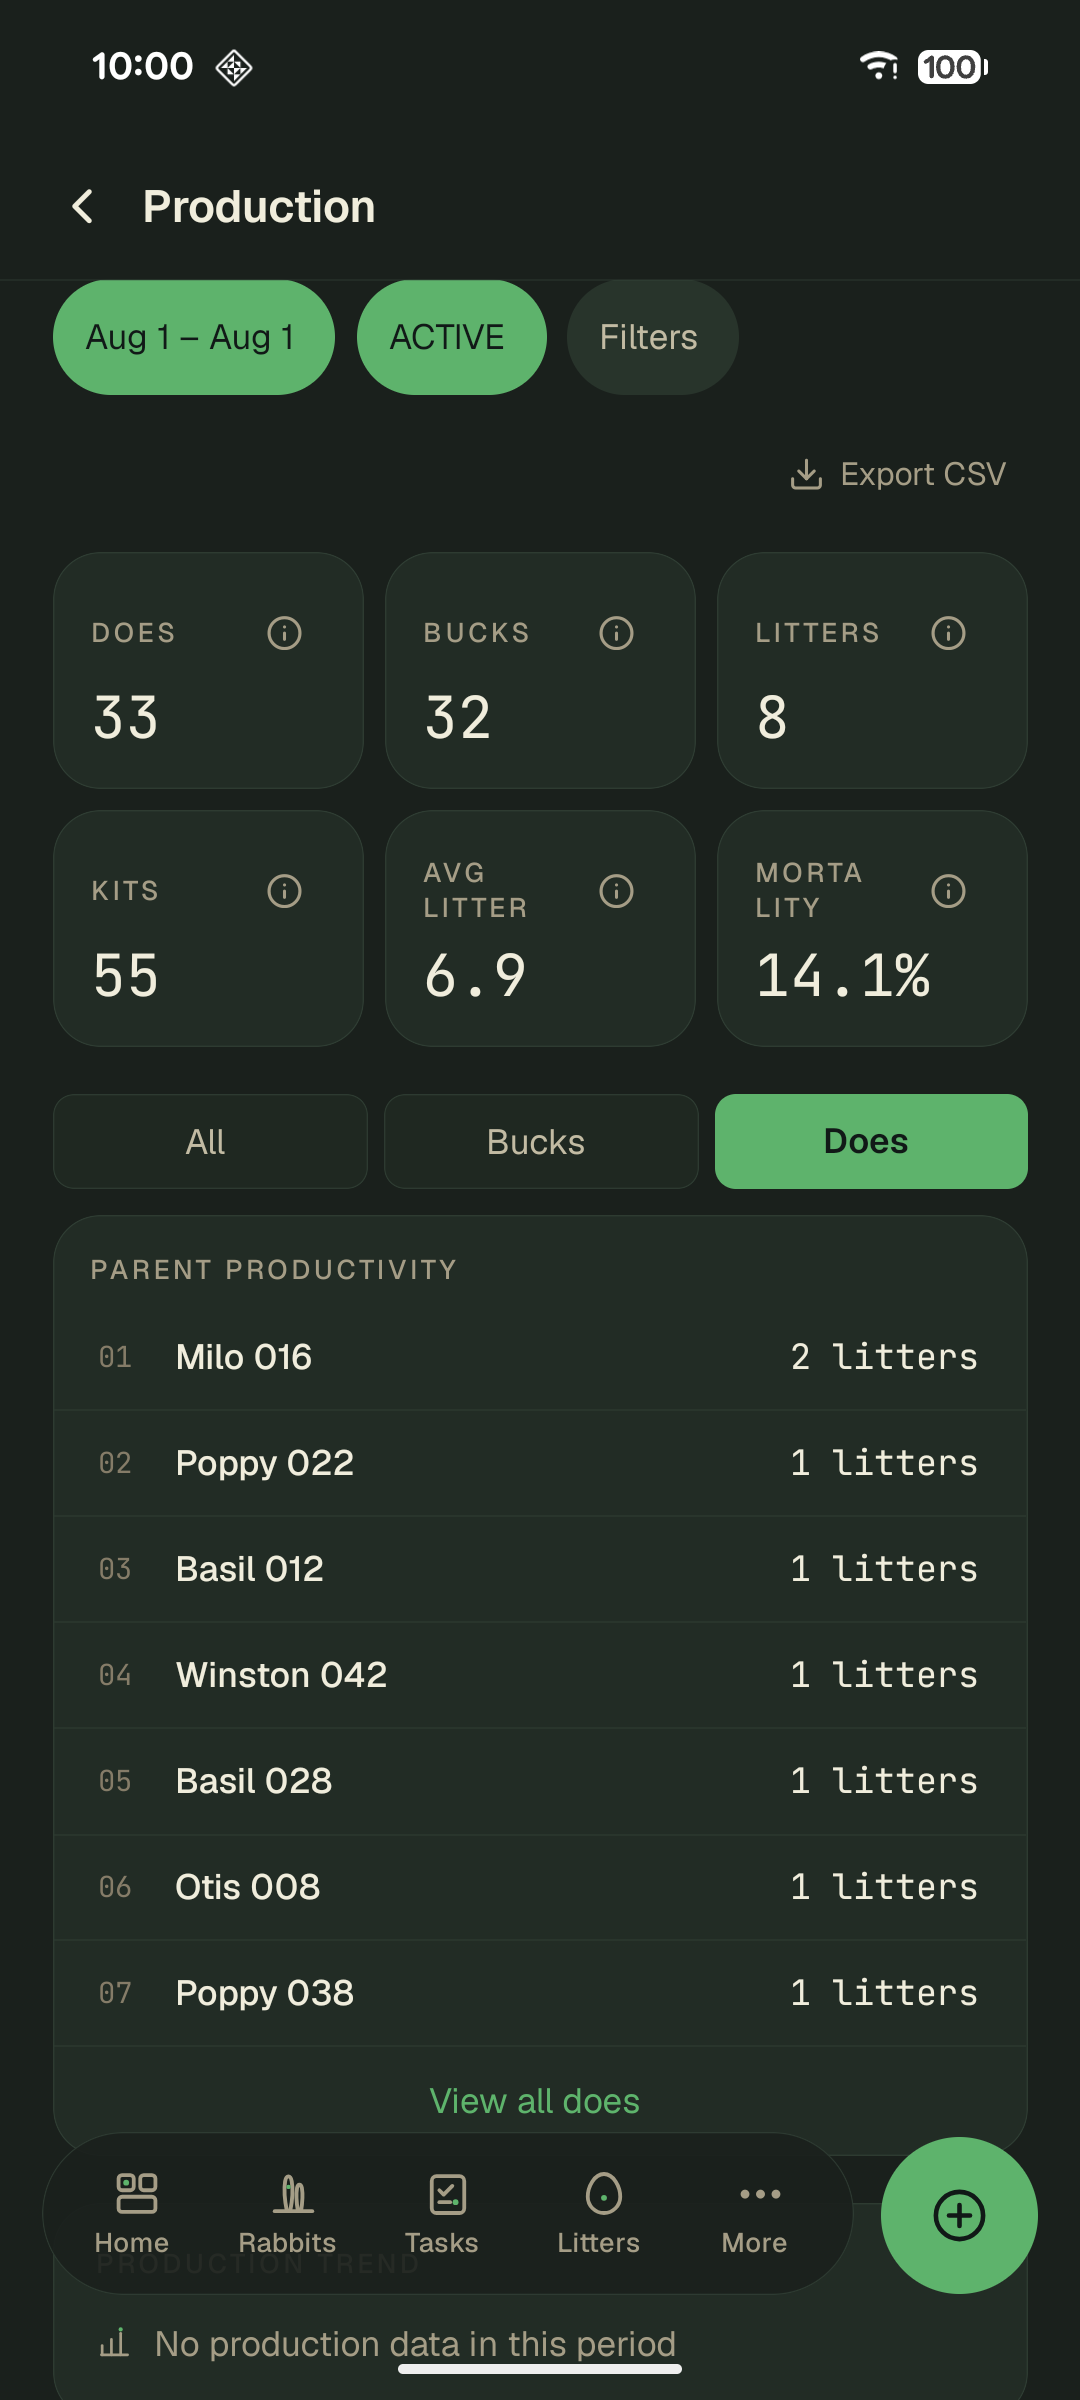
The KPI row answers how much the herd produced; the ranking underneath answers which does produced it. Widen the date range if the default window is quieter than your breeding schedule.