Analytics Overview
Analytics never asks you to enter anything. Every figure is derived from the rabbits, litters, weights, treatments, feed, harvests, shows, and money already in your account, which means a dashboard is really a report on how completely you have been recording. Each one tells you how much data it had to work with, so you know whether to trust it.
What analytics reads
There is no separate analytics data to maintain. Change a litter's kit counts and the production figures move; allocate feed and a conversion ratio becomes possible; record a harvest and dress-out appears. Nothing is cached behind your back.
The default window is the last year, and you can go back as far as ten. Comparisons — the little up and down changes beside a figure — are against the immediately preceding window of the same length, so a 90-day view compares with the 90 days before it.
The seven dashboards
| Dashboard | The question it answers |
|---|---|
| Production & does | Which does are actually producing, and how is the herd trending? |
| Feed & FCR | What is feed costing me per pound of gain? |
| Harvest | What are my carcasses yielding, and which parents produce the best? |
| Lines & COI | Which family performs best, and how inbred is the herd getting? |
| Show performance | How are we doing on the table? |
| Health & care | Is condition holding up, and what is under withdrawal? |
| Profitability | Which animals made money? |
Harvest analytics is documented alongside the recording flow it depends on, on Processing & Harvest.
Filters
Every dashboard takes the same filters:
- Date range: defaults to the last year.
- Breed
- Line: see Lines & Lineage.
Filters apply across the whole hub at once, so setting a line and then moving between dashboards keeps you looking at the same animals.
Accuracy depends on what you record
This is the part worth reading, because it is what separates a dashboard that helps from one that misleads.
Each dashboard reports its own confidence — high, medium, or low — based on how many records it actually had. A conversion ratio from two allocations is marked low for a reason. Alongside it, dashboards list what was missing, in plain language: "no feed allocations in period", "FCR requires at least two weight records for linked feed targets", "litter and growout feed costs are not allocated to individual rabbits".
Read those notes before you act on a number. They are the difference between "my feed conversion is poor" and "I have not recorded enough weights for this to mean anything".
- Weigh more than once. Any gain figure — ADG, feed conversion — needs at least two weights on the same animal inside the window.
- Allocate feed, do not just buy it. Unallocated feed is a cost with nothing to divide into.
- Record litter outcomes honestly, including misses and false pregnancies. Conception rate is only real if the failures are in there.
- Categorize transactions as you enter them. Profitability is only as good as the categories.
Where to find it
On the web, analytics is a hub at Dashboard → Analytics with tabs across the top — overview, production, harvest, feed, lines, show, and health & care — sharing one filter bar.
On the phone, each dashboard is its own screen, reached from the analytics index. The phone also has one the web does not: per-rabbit profit and loss, which exports to CSV.
A dashboard is a summary, not an export. Ranked tables are capped at 100 rows and detail lists at 200, so a very large herd sees the top of the list rather than all of it. For the complete data, take a data export.
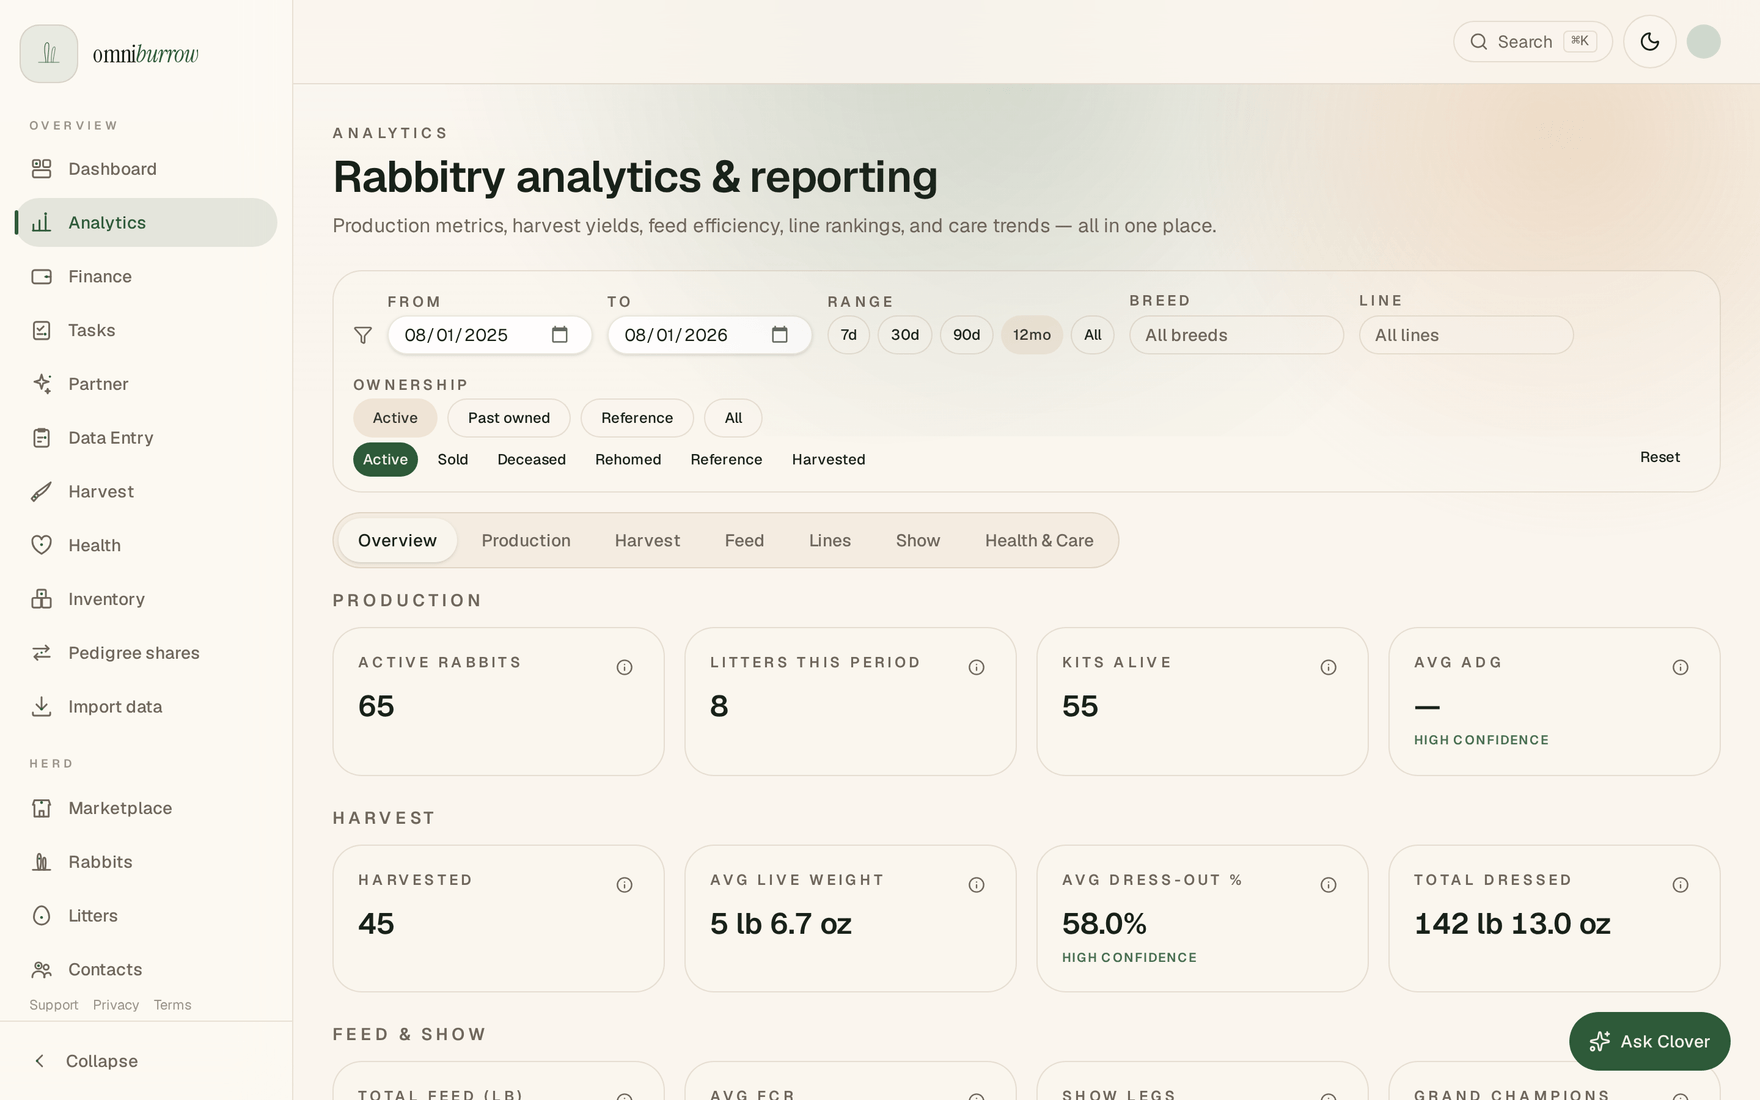
Web app: seven tabs share one filter bar, so a date range, breed, or line filter follows you across all of them.